What is the ‘Data Value Chain’?
To build data systems that are fair and useful, intersectionality must be woven into every stage of the data value chain, from planning and collection to analysis, sharing, and decision-making. Instead of treating identity as a checklist, intersectional policy development asks: Who participates in data collection? Whose voices are captured? How is data analysed and used? Does the final policy or product benefit everyone, especially those at the crossroads of different disadvantages?24
What is the ‘Data Value Chain’?
The Data Value Chain describes the evolution of data from collection to analysis, dissemination, and the final impact of data on decision making. In their model, data travels through four major stages: collection, publication, uptake, and impact. This journey relies on continuous feedback between data producers and stakeholders so the system can improve over time.25
The Data Value Chain moves through four major stages:
- Collection: How data about people and communities is gathered
- Publication: How collected data is released and shared
- Uptake: How data gets used by policymakers, researchers, civil society, and communities
- Impact: How data informs decisions, changes policies, and improves lives
At each stage, intersectionality asks: Who participates? Whose voices are captured? Who benefits? Who might be harmed?
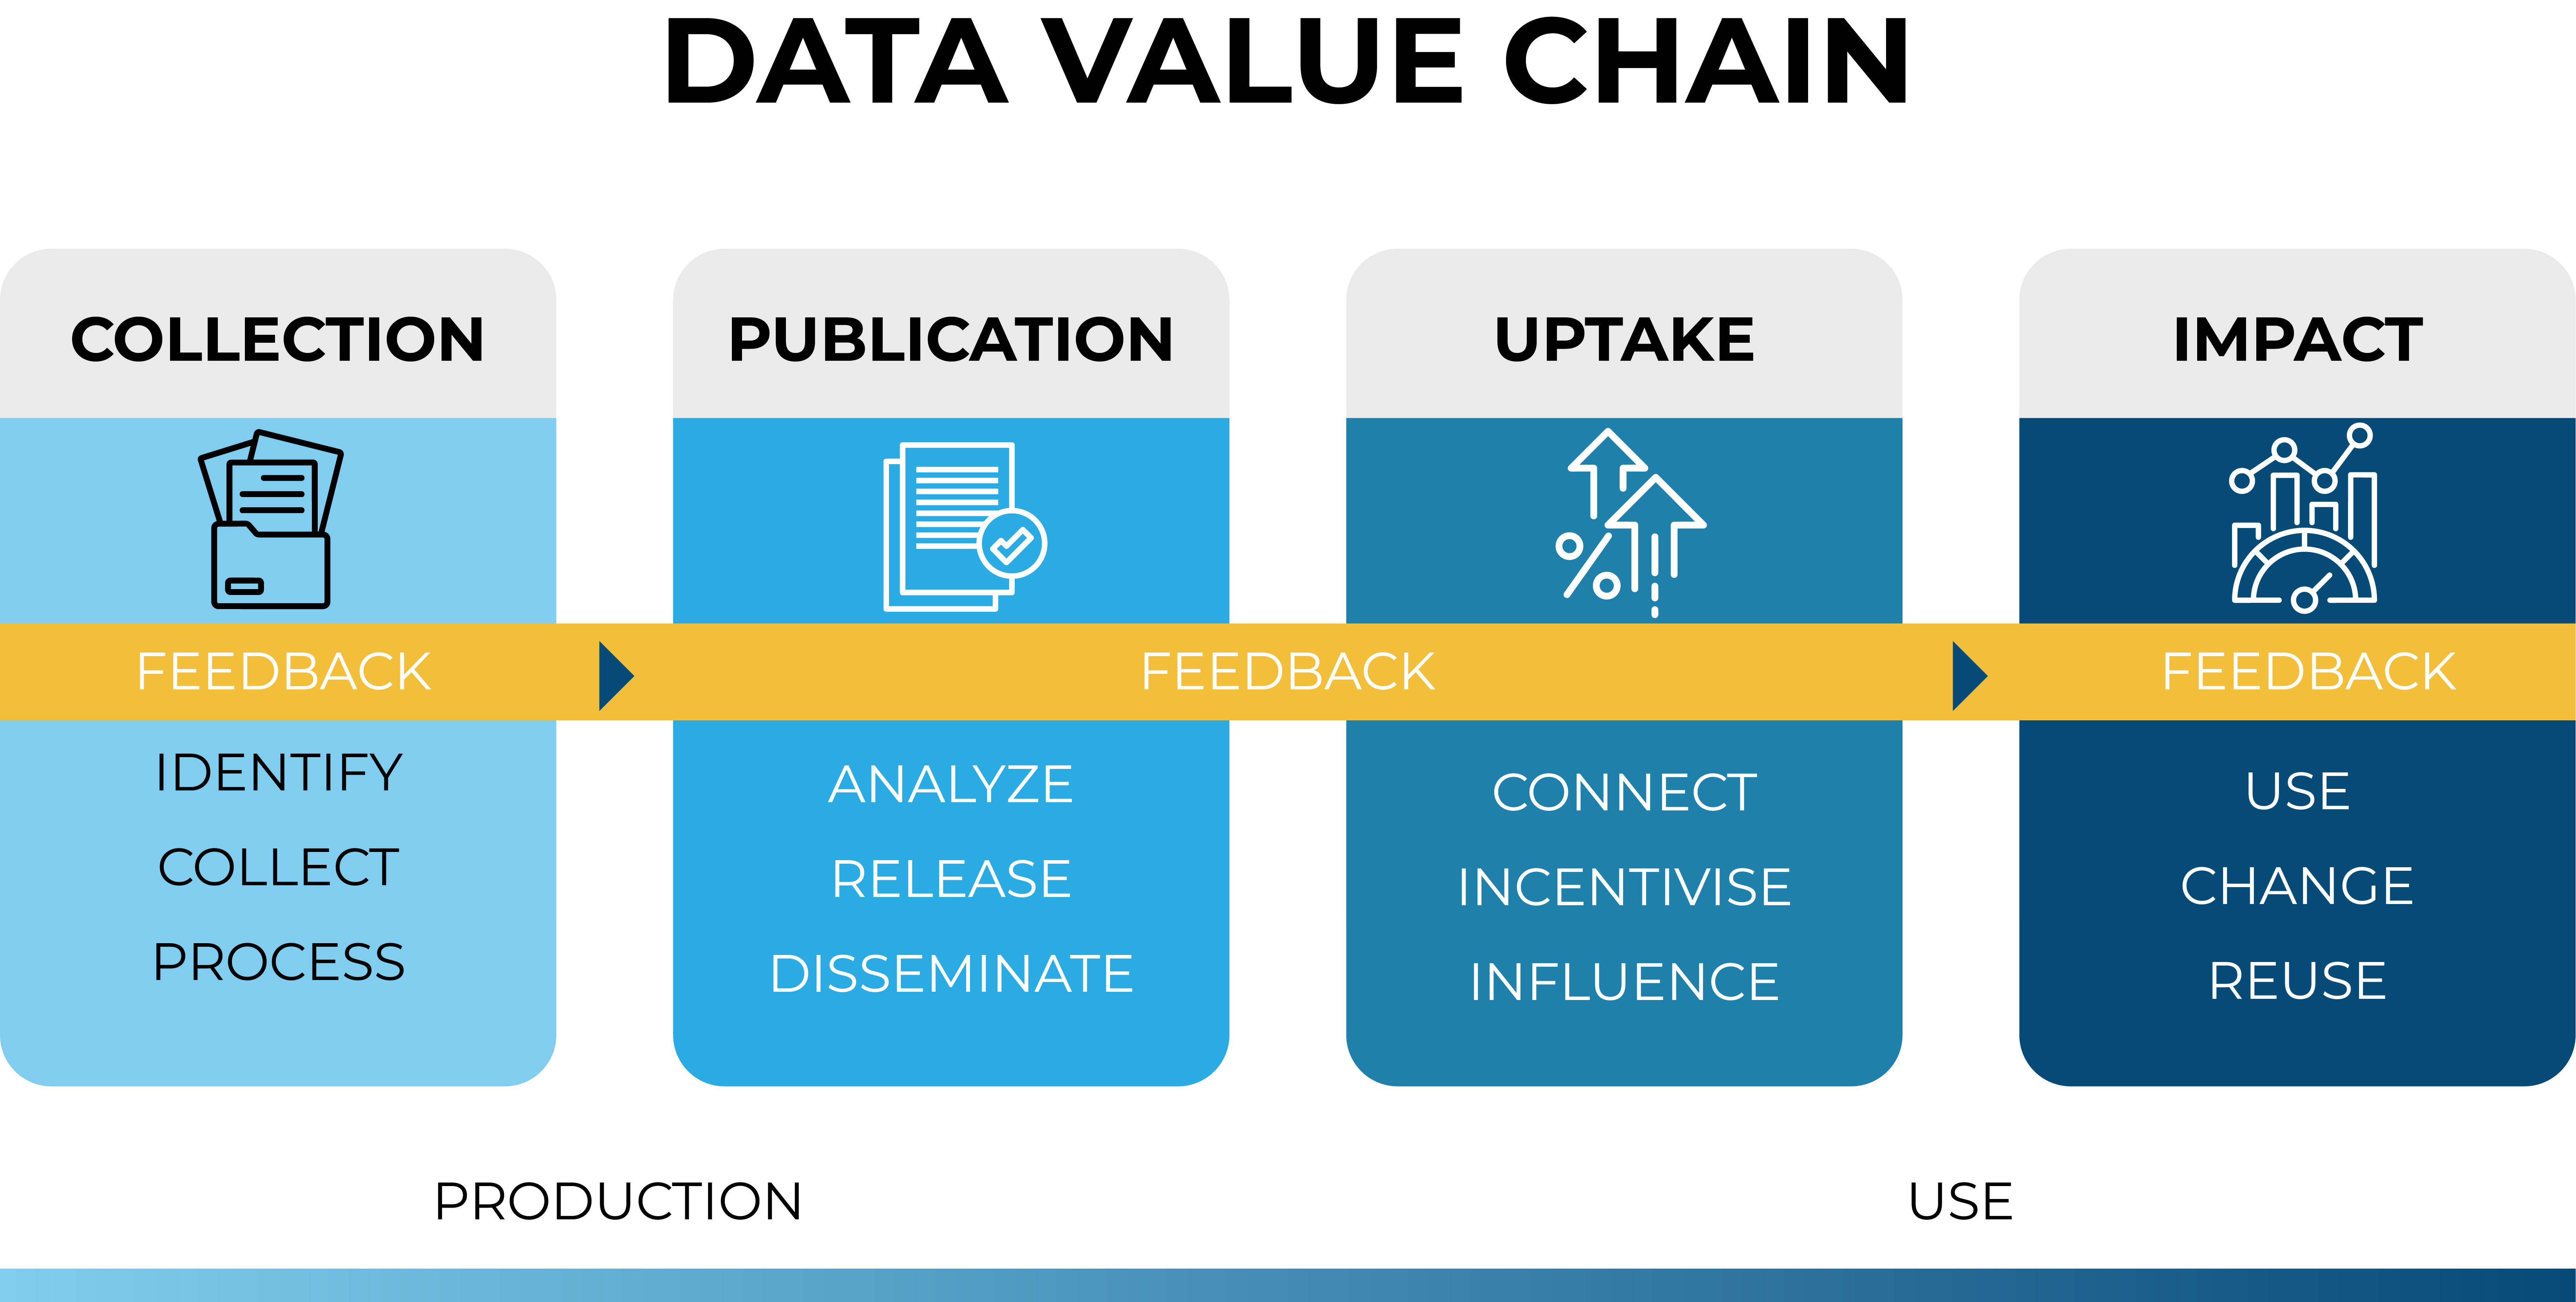
Source: Open Data Watch and Data2X
Five Stages of Establishing Intersectional Approaches to Data in Africa
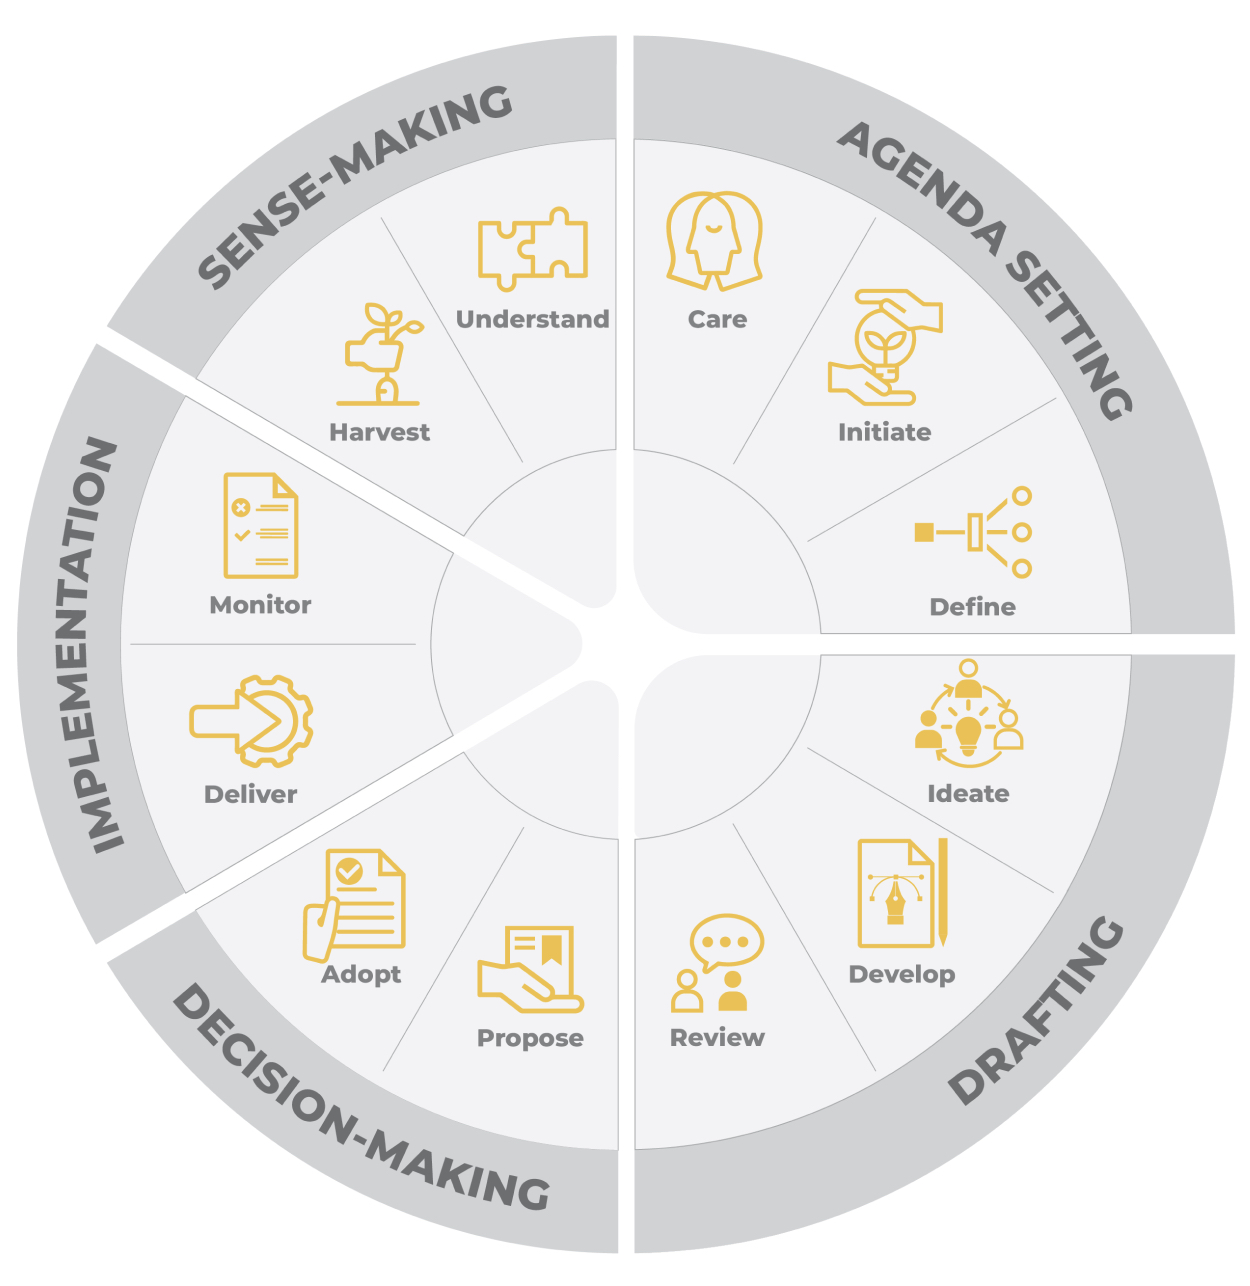
In addition to outlining the five stages of the data value chain, we will lightly apply i4Policy’s ADDIS Decision Thinking approach as a practical guide for how inclusive choices can be made within each stage of a policy cycle. ADDIS, a mnemonic for Agenda, Drafting, Decision-making, Implementation, and Sense-making. It is an approach to decision thinking that brings together approaches from modern and traditional policy cycle frameworks with the iterative, non-linear and modular nature of design thinking. The ADDIS methodology is broken down into 5 phases, and 12 steps.
We use ADDIS here as a “mini-cycle” to highlight recurring governance questions that show up across the chain.26 These questions include, but are not limited to, what matters and for whom, who needs to be involved, what options exist and which trade-offs are acceptable, how decisions will be implemented responsibly, and what can be learned and improved in the next iteration. By focusing on how decisions are implemented responsibly and what can be learned in the next iteration, this approach transforms abstract intersectional goals into action-oriented results.
The Five Stages of Establishing an Intersectional Approach
Listening to the Full Story
What is Data Collection?
Collection is how data about people and communities gets gathered in the first place. An intersectional approach means asking questions and designing surveys that let people express more than one part of who they are, like being a young, rural woman who’s differently abled, rather than just ticking a single box. This often means working directly with local organisations and trusted networks to reach those who are usually missed, and making sure that categories reflect real-life complexity, not just what’s easy to measure.
What’s at stake
Who gets counted, how, and by whom sets the foundation for all downstream data use. In many African contexts, intersecting identities, like gender, age, disability, language, and migratory status, often shape who is visible in official data and who remains hidden.
Intersectional Data Collection through an ADDIS lens
Operationalising Data Collection during the Agenda-setting phase – Care, Initiate, Define. Before tools are finalised, apply a short participatory cycle:

Care is the step where one better understands the situation by empathising with the people and organisations affected. In other words, before you design a survey or registry, you take time to learn what people’s lived realities look like, how they experience exclusion, and where harm or invisibility might happen. Because people at the margins often bear the greatest risks when data is misused or misunderstood, ‘Care’ requires being transparent about potential ways data could be used and getting stakeholder buy-in on the process, and make sure they feel the future categories and outputs chosen will reflect their realities fairly. This is also a preliminary stage to reflect on what safeguards (privacy, do-no-harm, anti-discrimination) must be built into the tool and the overall governance process.
- You can carry out activities like Focus Group Discussions, community round-table meetings, key informant interviews (or other listening methods) to understand who is missing and why, before finalizing categories and questions.
- It is also useful to consult with policy analysts as they can help prioritize disaggregation by key attributes important to national development, thereby validating questions and methodology, which leads to tailored strategies for data collection.27

Initiate is where we move from “we’ve heard the issues” to “we’ve set up the right group, values, and way of working to engage in this data collection process well.”
- The responsible institution can convene a small cross-sector working group (National Statistical Office, relevant ministry, CSOs, traditional leaders) and agree what “safe, inclusive data” means in this context.
Define is the step where institutions work together to identify and prioritise the specific issues to be addressed. It answers the questions, “What exactly are we trying to measure, for what decisions, and which intersections matter most in data collection?” to name a few.
- Given that we can’t disaggregate everything all at once, define is the moment where you choose, based on the previous steps: which identity axes are most decision-relevant (e.g., sex + age + disability + location), which groups are most likely to be missed, and what minimum categories you need so the data is usable without creating excessive burden or risk.
Intersectional data gathered through administrative systems and alternative sources, such as citizen-generated data, are particularly important for creating a data ecosystem that represents the interests and needs of all people.
Telling the Full Story
What is Publication?
Publication is about sharing the data that has been collected, so others can use it. With an intersectional lens, this means releasing data that is broken down by more than one category, such as gender and disability, or age and location. The goal is to make data available in formats and languages that are accessible to everyone.
What’s at stake
Publishing disaggregated data allows diverse actors to spot who is generally well included and where gaps persist. Yet, intersectional analysis is only possible when data is made available across more than one axis, such as gender and disability, or age and location.
Intersectional approach via the ADDIS process
For the Publication of data, the most relevant ADDIS steps are usually Define → Develop → Review, with an “Adopt” moment when safeguards need to be formalized.
Define what “safe and useful publication” means before anything goes live. This is where you decide which disaggregations are decision-relevant (e.g., sex + age + location, or disability where feasible), and which breakdowns should not be released because they could increase disclosure risk or expose small or stigmatized groups. In other words, intersectionality here is also about making careful choices about where disaggregation becomes unsafe.

Develop outputs that people can actually use. Open data, in this framing, is not “open in name only.” To be usable and equitable, data should be shared in machine-readable, non-proprietary formats, and paired with comprehensive metadata so users can extract, analyze, and reuse it reliably. This is also where accessibility is even more important, which means considering the language(s) data is published in and whether it is accessible to the marginalised groups revealed in earlier steps.
- Release data disaggregated by at least two or three key identities (e.g., sex, age, urban/rural, disability type).

Review the publication with the people the data is about, and the people who will use it. Open Data Watch highlights that analysts should continue consulting community representatives so the analysis reflects lived experience and asks the right questions. This is also where you protect agency and reduce harm. Given that intersectionality shifts the balance of “data ownership” toward subjects, publications should respect their concerns and apply strong privacy protections through data security measures and anonymization methodologies.
Adopt safeguards where needed, so they aren’t optional or informal. This is the moment to formalize publication rules (e.g., anonymization methodology, suppression thresholds, access conditions for sensitive microdata) and provide responsible-use guidance so data isn’t easily misinterpreted or weaponised.
Example
Rather than reporting on “youth unemployment” in general, show rates for urban youth, rural youth, young women, and youth with disabilities, so policy responses can be better targeted.
Bridging Data to Life
What is Uptake with Intersectionality?
Uptake is the stage when data gets used for decisions, policies, or services. Integrating an Intersectionality approach here means helping different actors, if necessary, understand how the data shows patterns of overlapping exclusion. It also means making sure those most affected by intersecting barriers are part of interpreting the data and shaping what actions come next.
What’s at stake
For data to drive equitable outcomes, it must reach those who can act on it and be understood in ways that reflect lived realities. In African countries, as in most places, this often means working with local governments, advocacy groups, and service providers to interpret intersectional data for decision-making.
Intersectional approach via the ADDIS process
At this stage, ADDIS is most useful during the following steps, Initiate → Develop → Propose/Adopt → Deliver/Monitor, with Sense-making feeding improvements back into earlier stages.
Initiate step: the responsible institution(s) will be building the bridge between producers and users (don’t assume uptake will happen). It’s best to bring together the people who turn data into decisions, such as policymakers, service providers, regulators, CSOs, community representatives, and more importantly, data intermediaries (journalists, civic tech actors, advocacy groups, policy units). These actors connect data to real audiences, translate technical outputs into usable narratives, and create feedback loops that encourage engagement and accountability.
Develop step: the responsible institution(s) could create the “translation layer” that makes intersectional patterns understandable. Given that uptake needs more than publishing and that it often needs products and spaces that help people use the data like briefs, dashboards, interpretation workshops, plain-language summaries, and community-facing formats. These resources would be considered data literacy and training.

Propose step: turns intersectional insights into options. This step calls for the translation of what the data shows into concrete decision options (policy change, targeting criteria, outreach strategy, service redesign, budget reallocation). This is where intersectionality matters most and where it’s best to ask what barriers only appear when identities overlap, and evaluate trade-offs so that solutions don’t help one group while leaving out (or harming) another.
Adopt step: makes inclusive use routine through incentives and governance. To prevent intersectionality from being optional, Open Data Watch and Data2X24 point to practical levers such as: donors can require inclusive data use and fund skills; governments can embed it in guidelines, standards, and regulations; institutions can make engagement with affected groups a normal step in decision workflows. Adoption here is also about working together to choose the rules and incentives that make equitable uptake repeatable.

Deliver/Monitor step(s): requires the support implementation and track whether decisions reach the intersections. Once decisions are made, uptake continues through execution where the entity communicates what’s changing and monitors whether actions actually reach the intended groups with identities that compound to increase their state of marginalisation. If not, adjust (delivery channels, eligibility rules, accessibility, outreach partners).

Harvest/Understand step(s): treat uptake as a constant learning opportunity, not a one-off. Gather evidence on what users understood, what they misinterpreted, what they couldn’t access, and what communities experienced after actions were taken. Feed those learnings back into publication (clearer documentation, safer disaggregation) and collection (better categories, improved reach). This is how uptake becomes a reinforcing loop rather than a dead end.
Example
A digital ID initiative partners with organizations representing women with disabilities to review uptake data. They identify that rural women with both disability and no formal address face distinct barriers, prompting targeted outreach or alternative registration options.
Tracking Change for All
What is ‘Impact’ with Intersectionality?
Impact is the change or results that come from using data. An intersectional approach tracks who benefits, and who doesn’t, once new policies or services roll out. It looks for gaps that only show up at the crossroads of different identities, and uses feedback from those most affected to refine future actions, making sure the system gets better at including everyone over time.
What’s at stake
The true test of intersectional data governance is whether real-life outcomes improve for those at the crossroads of multiple disadvantages. Policies that look effective in aggregate can still miss groups facing compounded barriers.
Intersectional approach via the ADDIS process
We’ve determined that the most useful steps for this stage are Define → Monitor → Harvest/Understand, with a clear link back to earlier stages when adjustments are needed.
Define → make success explicit across overlapping identities.
Define what “success” looks like in intersectional terms. Set indicators that track outcomes across overlapping identities (not just one dimension at a time), and specify which groups must see improved access or outcomes (e.g., rural women with disabilities without IDs; migrants in informal work; youth with psychosocial disabilities). This is where equity becomes measurable rather than assumed.
Monitor → track results and risks, not just reach.
Monitor implementation against the defined intersectional indicators, and also monitor harm. Using intersectional data responsibly means tracking both positive impacts and risks, especially privacy, exposure, stigma, and discriminatory outcomes. Clear ethical standards and transparent data governance help prevent harm, while ongoing monitoring allows quick adjustments when problems appear.
Harvest & Understand → pair numbers with lived experience, then adapt.
Harvest evidence from both quantitative monitoring and qualitative insight. Collect stories and other qualitative evidence from people at the “edges” of the system to catch gaps that indicators miss and to explain why a policy is working for some groups but not for others. Then make sense of what you’re learning and translate it into concrete changes—adjust targeting rules, redesign delivery channels, strengthen safeguards, or revise what data needs to be collected and published in the next cycle.
How this becomes a reinforcing loop (why it matters)
When people can see that intersectional data leads to real policy changes or improved services, trust grows, and so does demand for better data. Strong learning loops encourage continued participation, investment, and better practice, helping embed intersectionality into everyday decision-making over time.
Example
A government tracks the impact of a cash transfer program by the total number reached and by how many rural women with disabilities and no ID are included, adjusting strategies as needed to close remaining gaps.
Learning and Adapting
What is Feedback with Intersectionality?
Feedback is about creating ongoing channels for people, especially those at the margins, to share what works and what doesn’t in a meaningful way. It helps data producers, policymakers, and community groups learn where the approach is missing the mark and adapt quickly, making intersectionality a living, responsive part of the data system, not a one-off fix.
What’s at stake
No data system is perfect on the first try. Continual feedback from those who experience policy on the ground, especially those with complex, intersecting identities, is vital.
Intersectional approach via the ADDIS process
- Initiate
Set up channels that people can actually use community sessions, trusted facilitators, community scorecards, anonymous digital suggestion boxes, targeted focus groups. Pay attention to accessibility (language, disability access, safe formats), and make it clear who will receive feedback, how it will be protected, and what influence it will have. Feedback works best when those most exposed to risk can participate without fear of harm. - Define (only when deemed helpful)
Be explicit about what the feedback will shape, whether that be data categories, consent practices, publication rules, interpretation workshops, service delivery, safeguards, or policy instruments. This prevents feedback from becoming performative and sets expectations that input will lead to concrete decisions. - Harvest & Understand
Collect feedback regularly and organise it in a way that reveals patterns across intersecting identities. Combine “what people say” with what monitoring data shows to identify persistent gaps, unintended harms, or new forms of exclusion. This is where you make sense of the signal: What keeps repeating? For whom? In what context? - Deliver → close the loop (“you said / we did”).
Communicate what was heard and what will change, then implement those changes. Visible responsiveness is what builds legitimacy and trust, and it’s what motivates people to participate again in future collection and interpretation. This step is also where you decide whether to return upstream (e.g., revise collection categories, adjust publication safeguards, redesign uptake workshops).
Example
After rolling out a digital skills program, project teams conduct focus groups with young women with psychosocial disabilities to understand what worked, what failed, and how future interventions can be more inclusive.
How would you approach these scenarios?
How to Play
For each scenario, imagine you’re a policymaker, regulator, or CSO.
- What intersectional barriers do you see?
- What 2–3 steps would you take to solve it?
- Share your solution with the world.

The “Invisible” Entrepreneur
Fatoumata is a widowed woman, living in a rural border region. She runs a small informal market stall, speaks a local minority language, and doesn’t have a national ID. The latest women’s financial inclusion program is only accessible online, requires an official address, and documentation in French or English.
Prompt: What do you do to make sure Fatoumata, and other women like her, aren’t left behind?
Your Response

The Caregiver
Tidiane is a young man caring for his elderly grandmother and two siblings with disabilities. Her village recently became a pilot site for a digital health registry, but registration requires traveling to the district center, which he cannot leave his family to do.
Prompt: What steps would you recommend to identify and support someone in Tidiane’s shoes in data systems and services?
Your Response

The Farmer
Nuru, a woman in her fifties, runs a productive farm in a rural area recently connected to the internet. Unfortunately, agricultural extension programs and subsidies require digital registration and “youth innovation” is prioritised for new grants.
Prompt: What can be done to prevent older women farmers like Nuru from being sidelined by tech-focused, age-limited policies?
Your Response
24 Open Data Watch & Data2X. (2023). Integrating Intersectionality in Data Systems: A Practical Guide Across the Data Value Chain. https://opendatawatch.com/publications/integrating-intersectionality-in-data-systems/
25 Open Data Watch & Data2X. (2023). Integrating Intersectionality in Data Systems: A Practical Guide Across the Data Value Chain. https://opendatawatch.com/publications/integrating-intersectionality-in-data-systems/
26 To learn more about the ADDIS Decision Thinking approach, visit decisionthinking.org
27 Open Data Watch & Data2X. (2023). Integrating Intersectionality in Data Systems: A Practical Guide Across the Data Value Chain. https://opendatawatch.com/publications/integrating-intersectionality-in-data-systems/